

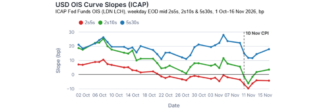
The US overnight-indexed swap curve did not simply move higher after the 10 November inflation release—it changed shape. The front and intermediate sections flattened sharply, with the 2s5s slope reaching −9.9 basis points and the 2s10s slope falling to −6.3 basis points on 11 November. By 16 November, those measures had recovered to −4.4 and +3.4 basis points respectively, while 5s30s rose from 11.7 to 17.8 basis points.
That partial recovery matters. It suggests the first response was not a permanent, parallel repricing of every maturity. Instead, the market initially concentrated the adjustment in the part of the curve most sensitive to the expected policy path, before reassessing how much tightening may persist further forward.
The shape of the curve reveals more than the level of rates
Looking only at outright swap rates can obscure the nature of a policy shock. A move in 2s5s or 2s10s shows how market expectations are being redistributed across time: whether participants see tighter policy as immediate and concentrated, or as a longer-lasting feature of the rate environment.
The contrast with 5s30s is important. The long-end slope remained positive and recovered more strongly by 16 November. That does not remove uncertainty, but it indicates that the most acute inversion was concentrated closer to the policy-sensitive portion of the curve rather than extending uniformly across the full maturity spectrum.
Partial normalization is not the same as reversal
By 16 November, 2s10s had returned to positive territory, but it remained far below its 1 October level of 18.6 basis points. Similarly, 2s5s improved from its post-release low but remained inverted, compared with +7 basis points on 1 October.
For practitioners, this distinction matters. A less inverted curve does not necessarily mean the underlying policy concern has passed. It may instead reflect adjustments in positioning, liquidity and the market’s assessment of how quickly restrictive policy will transmit. Valuation and risk models that rely on a single end-of-day snapshot can miss that path dependency.
Observable OTC pricing helps separate reaction from regime change
For trading and execution teams, the sequence can affect hedge timing and relative-value decisions. For risk managers, rapid changes in curve slopes can alter scenario relationships and expose assumptions that treat nearby tenors as moving together. For valuation teams, an observable and internally consistent curve history helps distinguish a temporary event-driven dislocation from a broader change in the rates regime.
The practical lesson is to examine both the shock and what happened afterwards. The 11 November inversion captured the immediate adjustment; the 16 November curve showed how the market subsequently redistributed that risk. Neither observation tells the full story alone.
Transparent OTC market information gives practitioners the context to evaluate that evolution rather than interpreting a single move in isolation.
To explore the underlying ICAP Fed Funds OIS curve data, request a Parameta Solutions data sample.
Disclaimer
© 2026 ICAP Information Services Limited (“IISL”). This communication is provided by ICAP Information Services Limited or a member of its group (“Parameta”) and all information contained in or attached hereto (the “Information”) is for information purposes only and is confidential. Access to the Information by anyone other than the intended recipient is unauthorised without Parameta’s prior written approval. The Information may not be not used or disclosed for any purpose without Parameta’s prior written approval, including without limitation, storing, copying, distributing, licensing, selling or displaying the Information, using the Information in an application or to create derived data of any kind, co-mingling the Information with any other data or using the data for any unlawful purpose of for any purpose that would cause it to become a benchmark under any law, regulation or guidance. The Information is not, and should not be construed as, a live price, an offer, bid, recommendation or solicitation in relation to any financial instrument or investment or to participate in any particular trading strategy or constituting financial or investment advice or a financial promotion. The Information does not constitute a public offer under any applicable legislation or an offer to sell or a solicitation of an offer to buy any securities. The Information is not to be relied upon for any purpose whatsoever and is provided “as is” without warranty of any kind, either expressly or by implication, including without limitation as to completeness, timeliness, accuracy, continuity, merchantability or fitness for any particular purpose. All representations and warranties are expressly disclaimed, to the fullest extent possible under applicable law. In no circumstances will Parameta be liable for any indirect or direct loss, or consequential loss or damages including without limitation, loss of business or profits arising from the use of or any inability to use the Information, or any inaccuracy in the Information. Parameta may suspend, withdraw or modify or change the terms of the provision of the Information at any time in its sole discretion, without notice. All rights, including without limitation intellectual property rights, in and to the Information are, and shall remain, the property of IISL or its licensors. Use of, access to or delivery of Parameta’s products and/or services requires a prior written licence from Parameta or its relevant affiliates. The terms of this disclaimer are governed by the laws of England and Wales.