Volatility continues in the metals market after a stormy start to the year. Silver prices crashed in January, driven by margin calls and flipping investor sentiment, but the silver market outlook is bright as fundamentals remain in play and silver prices rebound.
Policy moves in China and the US, persistent geopolitical tensions, supply and demand mechanics, and silver derivatives exposure have combined to create chaos for gold and silver prices in the last few months. Silver market trends can be difficult to predict; its role as a safe haven investment coupled with a real and growing need for the physical metal in high-tech manufacturing drives silver inflows to ETFs, the futures market and liquidity stress for the metal itself.
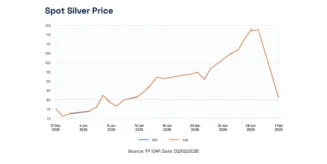
A snapshot of a meteoric rise
Silver entered 2026 in a parabolic rally, surging to highs of around $120/oz in January, a rise of 60-70% in a single month and a 150% increase from 2025. In late January, Citi analysts said in a note that silver was “behaving like ‘gold squared’ or ‘gold on steroids’” as investors looked to the metal as a safe haven amid trade tensions, high levels of geopolitical conflict and persistent concern about inflation and rising debt.1
The rise was initially sparked by relatively solid fundamentals. With geopolitical headwinds blowing in the background, the dollar was trending weaker and there were expectations that policy at the Federal Reserve would start to become more accommodating.
Silver is also a key metal for green tech and high-tech manufacturing, so demand is steadily increasing, driven by solar and electric vehicle growth, data-centre infrastructure expansion. At the same time, silver has been in a multi-year physical deficit as demand consistently exceeds mine supply. Only 30% of silver comes from silver mines, the rest is produced as a by-product of other metals, which makes it difficult to quickly ramp up supplies.2
On January 1, China shocked the market by reclassifying silver as a “strategic resource”, effectively putting it into the ‘rare earth club’ of minerals and metals required for cutting edge technologies. Because China controls around 70% of the silver that big tech, AI and solar firms need, its decision to restrict exports to 44 state-approved companies hit markets hard.3
As silver exports from China collapsed, Shanghai physical premiums spiked more than 10% and over 40 million ounces of silver was withdrawn from Shanghai warehouses. Warehouses for COMEX, the world’s primary derivatives exchange for trading metals futures and options, experienced a 33.45-million-ounce withdrawal in the first week of January, which was 26% of registered inventory.4
Market mentality or the fundamentals?
While there are physical pressures on the supply and demand of silver, analysts have also started to question whether the rally was partially driven by other market dynamics. The squeeze between physical and paper silver was one culprit as the paper-to-physical ration, which measures how many ounces of futures and derivatives contracts exist for each ounce of physical metal available for delivery, rocketed to 356:1 by January 28.5 On the same date, the March 2026 futures contract alone represented 528 million ounces of exposure against only 113 million ounces of registered silver. Silver lease rates spiked from 0.3% to 8% and there was increased investor demand for physical delivery of silver.6
This suggests that a real physical shortage of the metal was being compounded by leveraged futures pushing up prices. This trend has a good chance of being repeated through the year, if China holds to its strategy of export limits.
Sentiment flips and margins are called
As January drew to a close, US President Donald Trump announced that he intended to nominate Kevin Warsh as the next Federal Reserve Chair. Investors had been concerned that Trump’s choice would be someone more open to being led by the government, after the president repeatedly called out current Fed chair Jay Powell for not cutting interest rates. But Warsh is seen as an orthodox choice, hawkish on monetary policy and more likely to seek to stabilise and strengthen the dollar than to pursue aggressive rate cuts.7
The news caused investors to start to unwind safe-haven positions, which then spiralled into margin calls and a waterfall event as speculative traders were caught trying to get out quickly as prices plummeted. On January 30, silver plunged as much as 32% in a single session, its worst day since 1980, with futures trading down 31.4% and spot prices down 28%.8 Gold was also hit, dropping 9 to 11% in the sharpest one-day decrease in decades, while the US dollar jumped around 1%.9
In the post-analysis, the boom-and-bust cycle looked like a meme stock debacle, even as prices started to rebound somewhat in early February. Traders told the Financial Times that speculative investment from individual retail traders, particularly in Asia, had been a key driver for high prices, pouring a record $1bn into silver ETFs in January.10 As leveraged traders were hit with margin calls, they were forced to liquidate their holdings, accelerating the collapse of silver prices.11
According to FT calculations, ETFs tracking gold and silver have lost around $150bn of their value since the market peak in January.12
However, the rebound indicates that the fundamental issues with demand and China’s policy moves for silver has overridden deleveraging panic. What was seen in the market in the early part of the year may well be repeated as the underlying demand for silver is unlikely to drop. As long as China continues to curb exports and high-tech needs grow, the silver market is at risk of volatility.
Using OTC data to better understand market volatility
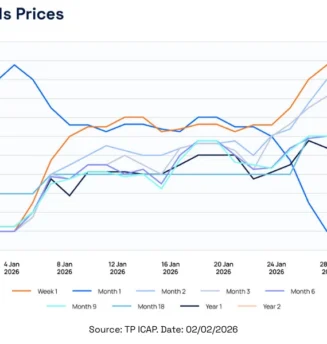
Understanding these price shifts is key for traders in the metals markets. Parameta offers transaction-based OTC data derived from TP ICAP’s broker network, giving visibility into actual trades, executable axes, and market standards, rather than just screen quotes. The silver EOD curves from TP brokers can help show the shape and shifts of the forward curve, such as the contango/backwardation episodes during the squeeze, along with volatility term structure and how it has evolved through this episode.
Trade and Order level data provide valuable insight into the drivers of price movements, such as shifts in ticket size and volume, the growing presence of non‑traditional participants, and changes in average trade size. This granularity also helps track how much activity is being settled financially versus physically, offering additional context on market positioning and risk transfer.
In periods of weak liquidity, this granular data helps market observers identify early warning signals, including widening bid‑ask spreads, reduced depth, and sudden “air pockets” during sharp market rallies. Patterns such as clusters of cancelled or amended orders, surges in trade‑at‑settlement volumes, and concentrated activity around key fixings can further signal emerging stress in the market.
Parameta Solutions is a leading specialist in OTC Metals market data. Sourced exclusively from the trading desks of TP ICAP, we deliver high quality, independent data to buy side and sell side institutions.
- Precious & battery metals coverage: Real time pricing for gold, silver, platinum and palladium in EMEA, plus weekly pricing for lithium, cobalt, spodumene and rhodium in APAC.
- Flexible, integrable datasets: Designed for seamless integration into enterprise systems to support trading, risk and planning workflows.
To access more information about our Energy & Commodities data solutions, please contact us for a data sample or further information.
Bibliography
Bibliography
[1] https://www.nytimes.com/2026/01/28/business/silver-gold-prices.html
Read Source[2] https://www.statista.com/statistics/253629/percentage-of-global-silver-production-by-primary-source/?srsltid=AfmBOopZs4fQwZOYf4YrnL7A4wgQ9w_sKCsX-FTZo80hwlmQrY-YNt8x
Read Source[3] https://www.morningstar.com/news/marketwatch/2026010376/china-is-using-silver-as-an-economic-weapon-what-that-means-for-investors-and-prices
Read Source[4] https://www.investing.com/analysis/silver-how-structural-deficits-are-setting-up-a-onceinageneration-move-200674048
Read Source[5] https://www.investing.com/analysis/silver-how-structural-deficits-are-setting-up-a-onceinageneration-move-200674048
Read Source[6] https://www.investing.com/analysis/silver-how-structural-deficits-are-setting-up-a-onceinageneration-move-200674048
Read Source[7] https://www.ft.com/content/4a6e2113-44d5-489a-87a9-9f4d173840ab
Read Source[8] https://www.cnbc.com/2026/01/30/silver-gold-fall-price-usd-dollar-fed-warsh-chair-trump-metals.html
Read Source[9] https://www.cnbc.com/2026/01/30/silver-gold-fall-price-usd-dollar-fed-warsh-chair-trump-metals.html
Read Source[10] https://www.ft.com/content/8c6966f0-689c-454b-96bb-d406e6857ad6
Read Source[11] https://www.cnbc.com/2026/01/30/silver-gold-fall-price-usd-dollar-fed-warsh-chair-trump-metals.html
Read Source[12] https://www.ft.com/content/8c6966f0-689c-454b-96bb-d406e6857ad6
Read SourceDisclaimer
© 2025 ICAP Information Services Limited (“IISL”). This communication is provided by ICAP Information Services Limited or a member of its group (“Parameta”) and all information contained in or attached hereto (the “Information”) is for information purposes only and is confidential. Access to the Information by anyone other than the intended recipient is unauthorised without Parameta’s prior written approval. The Information may not be not used or disclosed for any purpose without Parameta’s prior written approval, including without limitation, storing, copying, distributing, licensing, selling or displaying the Information, using the Information in an application or to create derived data of any kind, co-mingling the Information with any other data or using the data for any unlawful purpose of for any purpose that would cause it to become a benchmark under any law, regulation or guidance. The Information is not, and should not be construed as, a live price, an offer, bid, recommendation or solicitation in relation to any financial instrument or investment or to participate in any particular trading strategy or constituting financial or investment advice or a financial promotion. The Information does not constitute a public offer under any applicable legislation or an offer to sell or a solicitation of an offer to buy any securities. The Information is not to be relied upon for any purpose whatsoever and is provided “as is” without warranty of any kind, either expressly or by implication, including without limitation as to completeness, timeliness, accuracy, continuity, merchantability or fitness for any particular purpose. All representations and warranties are expressly disclaimed, to the fullest extent possible under applicable law. In no circumstances will Parameta be liable for any indirect or direct loss, or consequential loss or damages including without limitation, loss of business or profits arising from the use of, any inability to use, or any inaccuracy in the Information. Parameta may suspend, withdraw or modify or change the terms of the provision of the Information at any time in its sole discretion, without notice. All rights, including without limitation intellectual property rights, in and to the Information are, and shall remain, the property of IISL or its licensors. Use of, access to or delivery of Parameta’s products and/or services requires a prior written licence from Parameta or its relevant affiliates. The terms of this disclaimer are governed by the laws of England and Wales.